Conduit 0.4 is out! Conduit’s a tool to help developers build streaming data pipelines between production data stores and messaging systems. For example, if you’ve ever used tools like Kafka Connect, Conduit can be used as a drop-in replacement to help stream data to Apache Kafka. With this release the theme was error handling and debugging. Here’s a look at some of the more interesting features as part of this release.
Stream Inspector
Building data pipelines is more difficult than, say, building a web application. In web applications, the developer is in control of the user inputs and the data coming into the system. With data pipelines and data applications, the system has to respond to whatever data is given to it. This means schemas and associated data may change over time and the system has to be able to handle it. In these situations, being able to see what the data looks like throughout the Conduit pipeline is critical to being able to debug what’s happening.
In this release, developers will now be able to peek at the data as it enters Conduit via source connectors and what the data looks like as it travels to destination connectors. The ability to peek at data as it enters or leaves processors will be coming in a future release. Keep in mind that this feature is about sampling data as it passes through the pipeline not tailing the pipeline.
$ wscat -c ws://localhost:8080/v1/connectors/pipeline1:destination1/inspect | jq .
{
  "result": {
    "position": "NGVmNTFhMzUtMzUwMi00M2VjLWE2YjEtMzdkMDllZjRlY2U1",
    "operation": "OPERATION_CREATE",
    "metadata": {
      "opencdc.readAt": "1669886131666337227"
    },
    "key": {
      "rawData": "NzQwYjUyYzQtOTNhOS00MTkzLTkzMmQtN2Q0OWI3NWY5YzQ3"
    },
    "payload": {
      "before": {
        "rawData": ""
      },
      "after": {
        "structuredData": {
          "company": "string 1d4398e3-21cf-41e0-9134-3fe012e6d1fb",
          "id": 1534737621,
          "name": "string fbc664fa-fdf2-4c5a-b656-d52cbddab671",
          "trial": true
        }
      }
    }
  }
}
Stream inspection is available via the Conduit API and Dashboard.
Dead Letter Queues
Continuing the theme of failures throughout a data pipeline, what should happen with the data if it’s failed to be processed? Dead Letter Queues are one such way. Let’s assume that if a message does have an error in it, in Conduit 0.4, you now have the option of sending the message to another connector to be saved. What you do with that message is up to you. For example, you could choose to create another Conduit pipeline to reprocess once you’ve figured out the root cause.
To get started with a Dead Letter Queue, you have to specify that you want one as part of your pipeline in the Conduit Pipeline Configuration File:
version: 1.1
pipelines:dlq-example-pipeline:
	connectors:
    	[...]
    dead-letter-queue:
    	# disable stop window
        window-size: 0

        # the next 3 lines explicitly define the log plugin
        # removing this wouldn't change the behavior, it's the default DLQ config
        plugin: builtin:log
        settings:
        	level: WARN
Dead Letter Queues can only be created by using the Pipeline Configuration file. In future releases, we plan to make this functionality available via Conduit’s API.
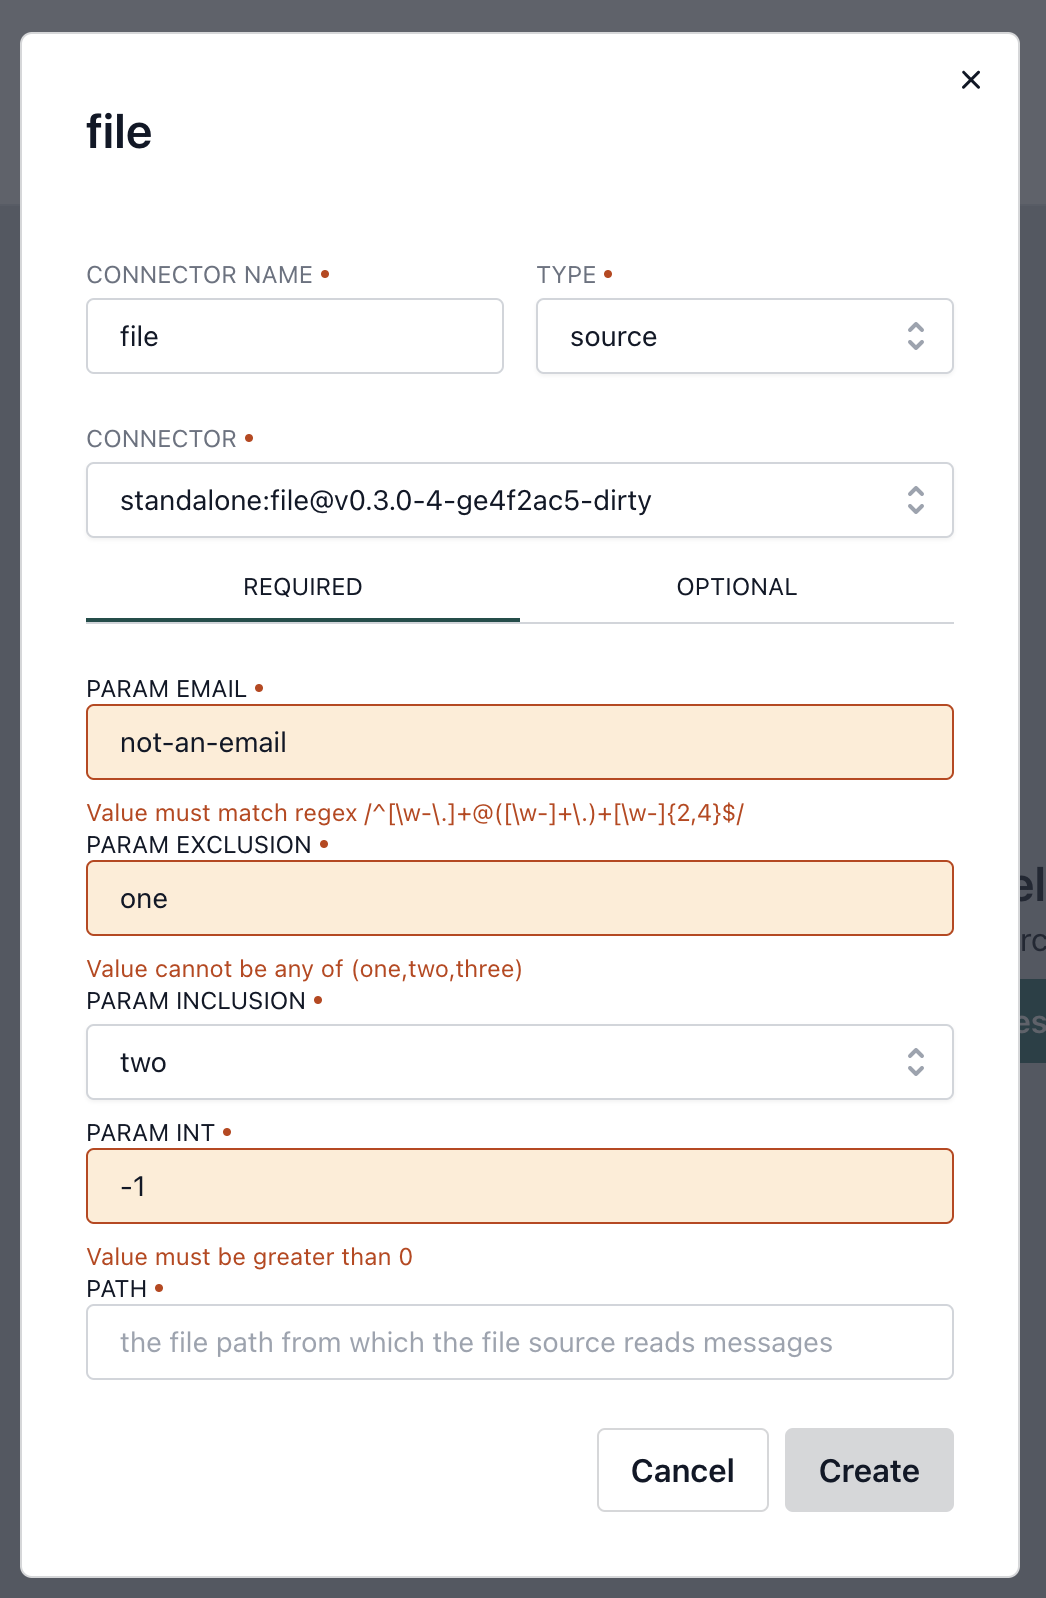
Connector Parameter Validation
Conduit connectors can require any number of parameters and data types to be able to successfully connect to a variety of data stores. In this release, Conduit connector developers can now encode the required parameters in their connectors and Conduit will surface the correct error messages to the end users. This is huge because this should help provide consistent messages and make the connector setup process easier.
And the rest
If you want to see the full list of what was included in this release, check out the Conduit Changelog and the documentation. Also, feel free to join us on Discord or Twitter.


