
Introduction
When we began developing Conduit, we prioritized building features to make it a viable Kafka Connect replacement, performance was a secondary consideration. We are fans of the principle "Make it work, make it right, make it fast." This doesn't mean we neglected performance entirely—in 2022, we wrote about our initial benchmarks that tested Conduit's performance. These benchmarks helped us monitor performance and quickly identify any regressions.
With Conduit approaching its 1.0 release and a fairly mature feature set in place, we’ve decided to spend some time focusing on performance. Our recent redesign of the pipeline execution system delivered a 5x performance boost. We've also created Benchi, a benchmarking tool that will help us test the performance of Conduit and its connectors, as well as compare it with similar tools.
This post kicks off a series comparing Conduit’s performance with Kafka Connect. We’ll explore how we measured and tweaked the performance of a pipeline that streams data from MongoDB to Kafka and how it compares against Kafka Connect and the MongoDB connector.
Methodology
Performance measurement
For our testing we’re focussed on three metrics, message throughput, CPU utilization, and Memory Usage. Record throughput within Conduit is tracked using Conduit’s metrics, the throughput of Kafka messages is measured using JMX in the Kafka broker, and resource usage is monitored with the information that Docker exposes.
Snapshots vs CDC
The performance expectations for snapshots and change data capture (CDC) are naturally different. With snapshots you’re copying existing data, so while you want it to be fast, a snapshot may take days for large datasets. CDC streaming, must be fast enough to keep up with realtime inserts and updates in the data source. Due to these differences, we measure performance separately for snapshot and CDC modes.
In a snapshot test, the test data is inserted before data streaming starts (i.e. before a pipeline is started in Conduit/a source connector is created in Kafka Connect).
In a CDC test, the steps are:
- streaming is started
- streaming is paused
- all test data is inserted
- streaming is started again
Starting and then pausing data streaming makes the tool (Conduit or Kafka Connect) switch into CDC mode (as it realizes that there’s no snapshot data, and can start listening for changes). The reason why we’re inserting the test data while data streaming is stopped is so that the new data is available as soon as the connector starts. When investigating bottlenecks, this removes the need to investigate the step where data is being inserted (which might be a script, a test app, etc.). Also, this exercises the tool and the connector even more, as the data is already available.
Setup
All of our tests were performed multiple times on a t2.xlarge AWS EC2 instance (4 vCPUs, 16 GB RAM) with a 40 GB gp3 EBS volume. The needed infrastructure (Kafka, MongoDB) was provided via Docker containers. We ran a single Kafka broker and a three-member MongoDB replica set.
The configuration for snapshots and CDC tests can be found here and here. Here are some notable configurations.
Conduit
We tested Conduit v0.13.2 with the MongoDB connector v0.2.2. Conduit is run with the re-architectured pipeline engine and has been modified to include the MongoDB connector as a built-in connector (and not as a standalone). This increases performance and is also more similar to how Kafka Connect connectors work (they are added to the classpath and run as part of the Kafka Connect service). The pipeline configurations can be found here and here. The option to automatically generate schemas has been turned off. We also turned off compression in the Kafka destination connector (which is also done in Kafka Connect).
Kafka Connect
We tested Kafka Connect v7.8.1 with MongoDB’s Kafka connector v1.15.0. The Kafka Connect worker uses the default settings. We use the MongoDB connector, with some custom configurations such as: schema inferring is disabled, the entire document is returned in CDC (the default setting returns the differences between the original document and the updated document), and the batch size.
Running the tests
Our benchmarks are implemented to run on Unix-like OSes and use the Benchi tool that we wrote. To download the benchmarks:
curl -L https://github.com/ConduitIO/streaming-benchmarks/archive/refs/heads/main.zip -o streaming-benchmarks.zip
unzip streaming-benchmarks.zip
To run all the benchmarks, execute the following command:
cd streaming-benchmarks-main && make install-tools run-allBottlenecks
Since we used the same MongoDB and Apache Kafka instances to test both tools, we didn't focus on optimizing these components. We started by testing Conduit to establish a baseline, which showed it could process approximately 14,000 messages per second on our test machine. This felt a little low so we decided to do some optimizing.
To look understand the components involved it helps to have an understanding of the structure of a Conduit pipeline. The Diagram below shows the components of our pipeline.
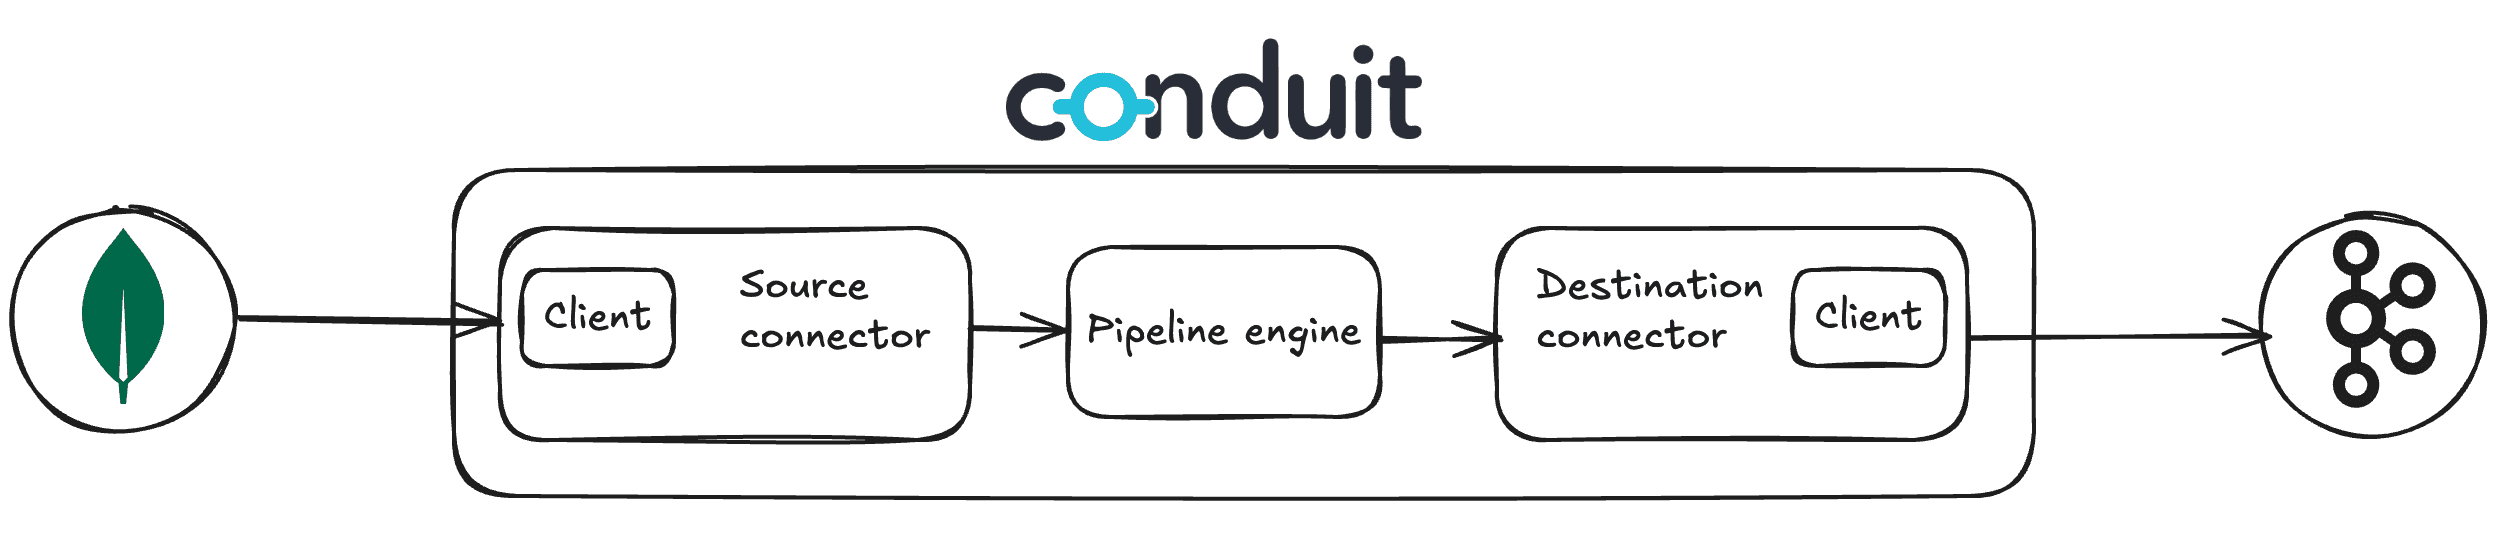
We decided to break things down and evaluate each component individually.
This meant testing the following in isolation:
- How quickly can the MongoDB source connector read the data?
- How quickly can the MongoDB client read the data?
- How quickly can the Kafka destination connector write the data?
- How quickly can the Kafka client (we’re using franz-go) write the data?
The MongoDB source connector and the MongoDB client were able to read around 25k documents per seconds. We got some similar results for the Kafka destination connector which definitely meant that the bottleneck was Conduit itself.
Because of that, we gave the new pipeline architecture a try, and it resulted in quite a boost! The message rate went from 14k to 23k msg/s.
Results
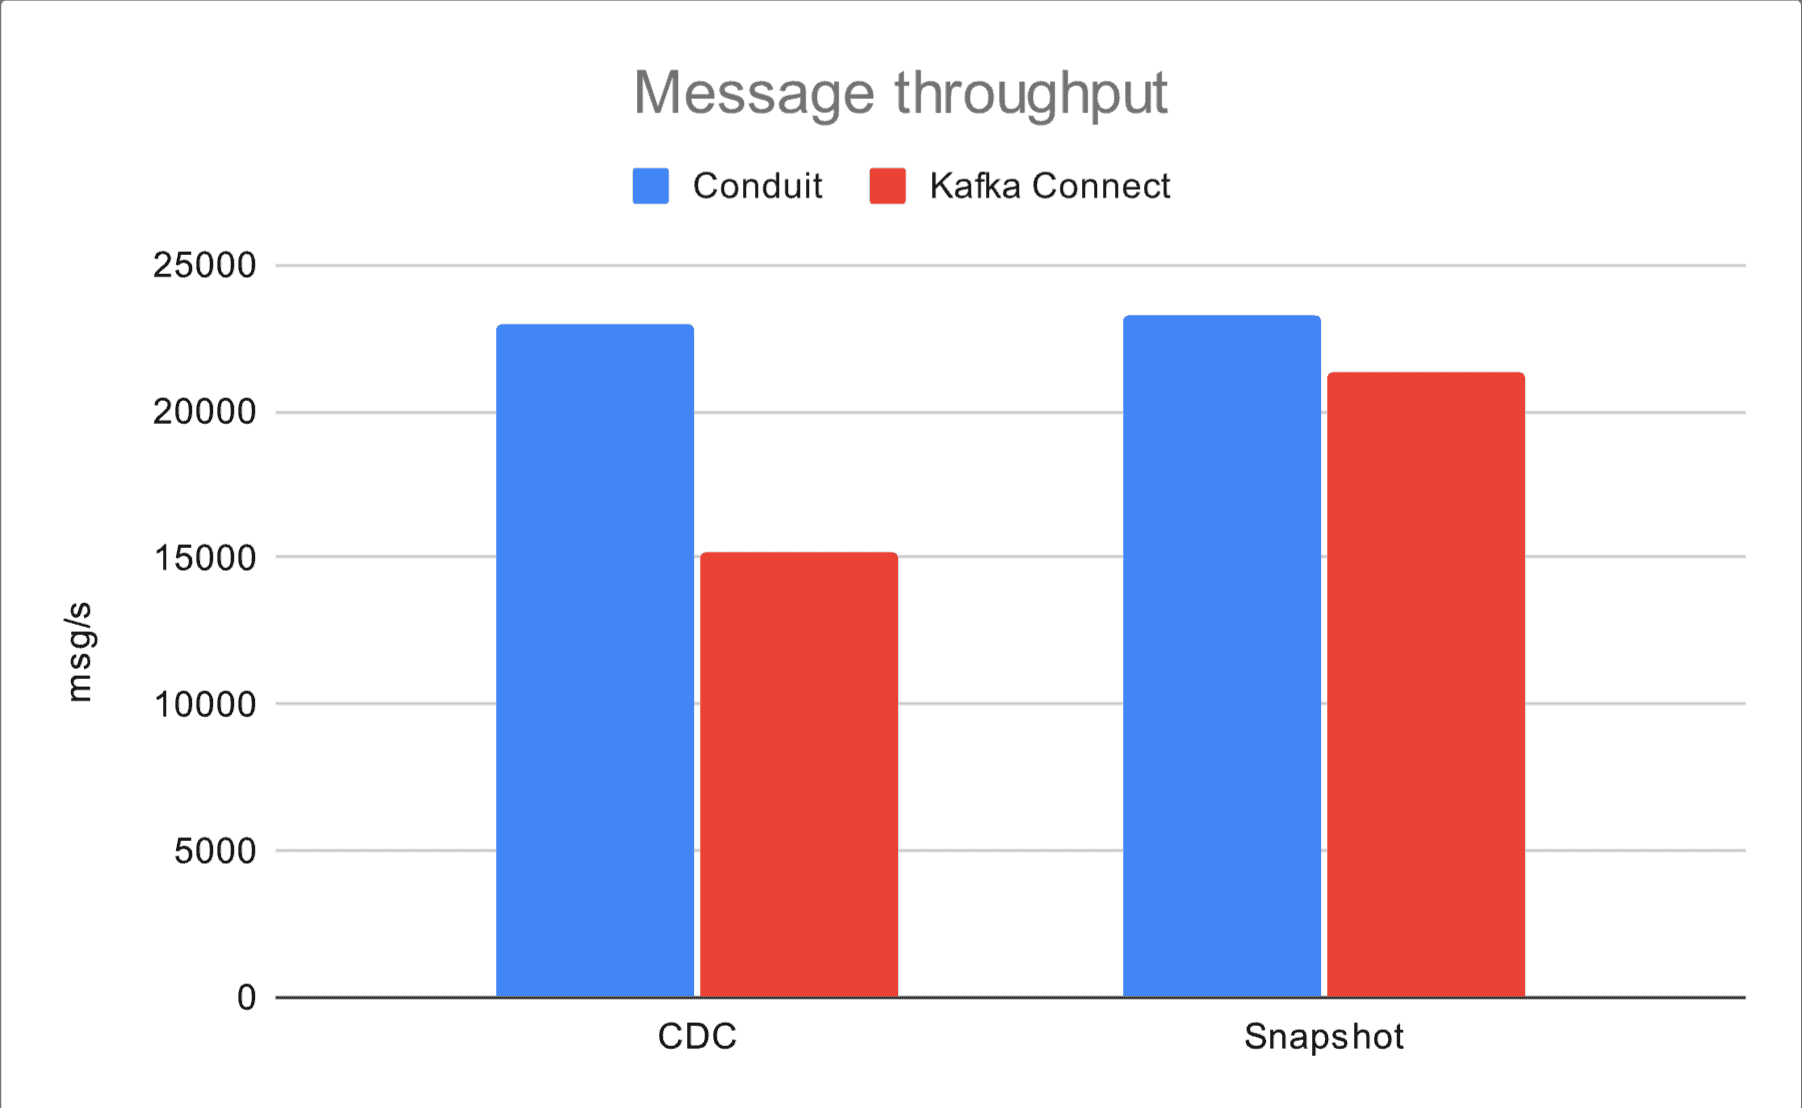
Here we present a comparison between Conduit and Kafka Connect, which includes the message rates (for both, snapshot and CDC modes) as well as resource usage. The charts below summarize results from 56 runs of CDC and snapshot tests.
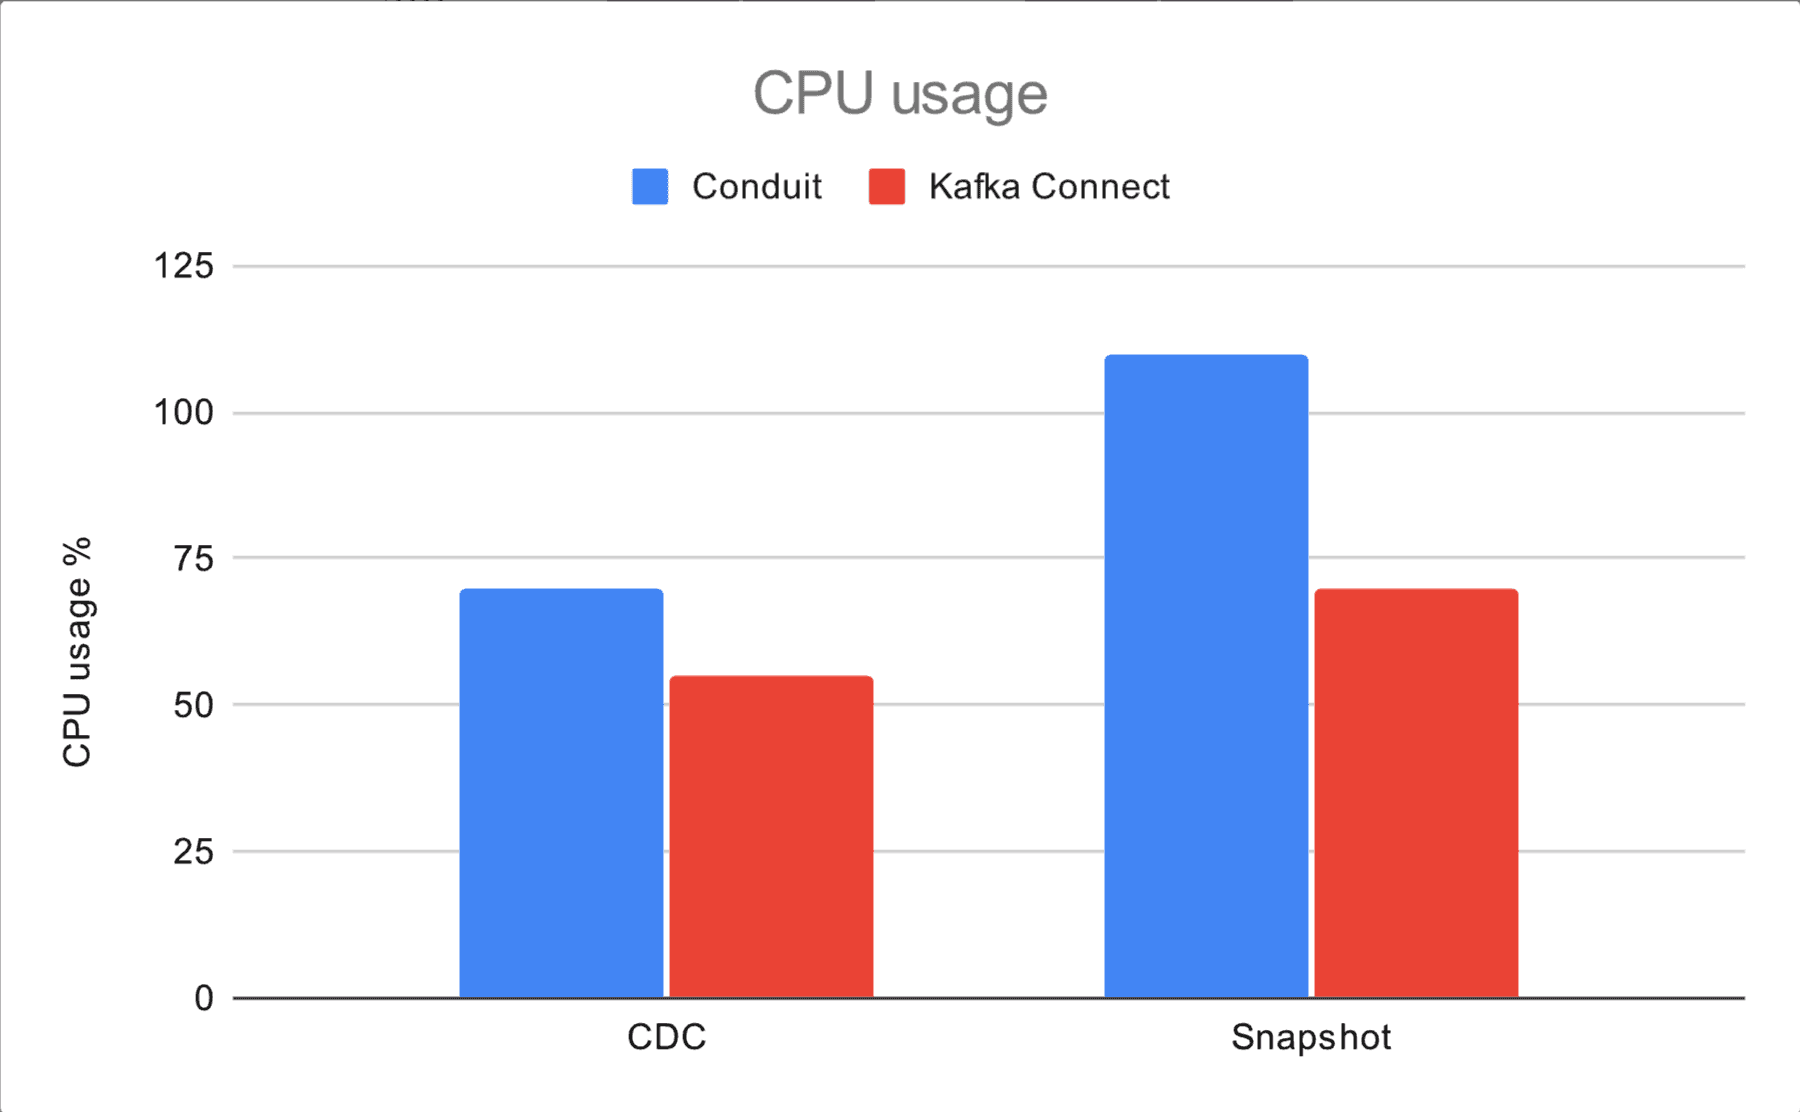
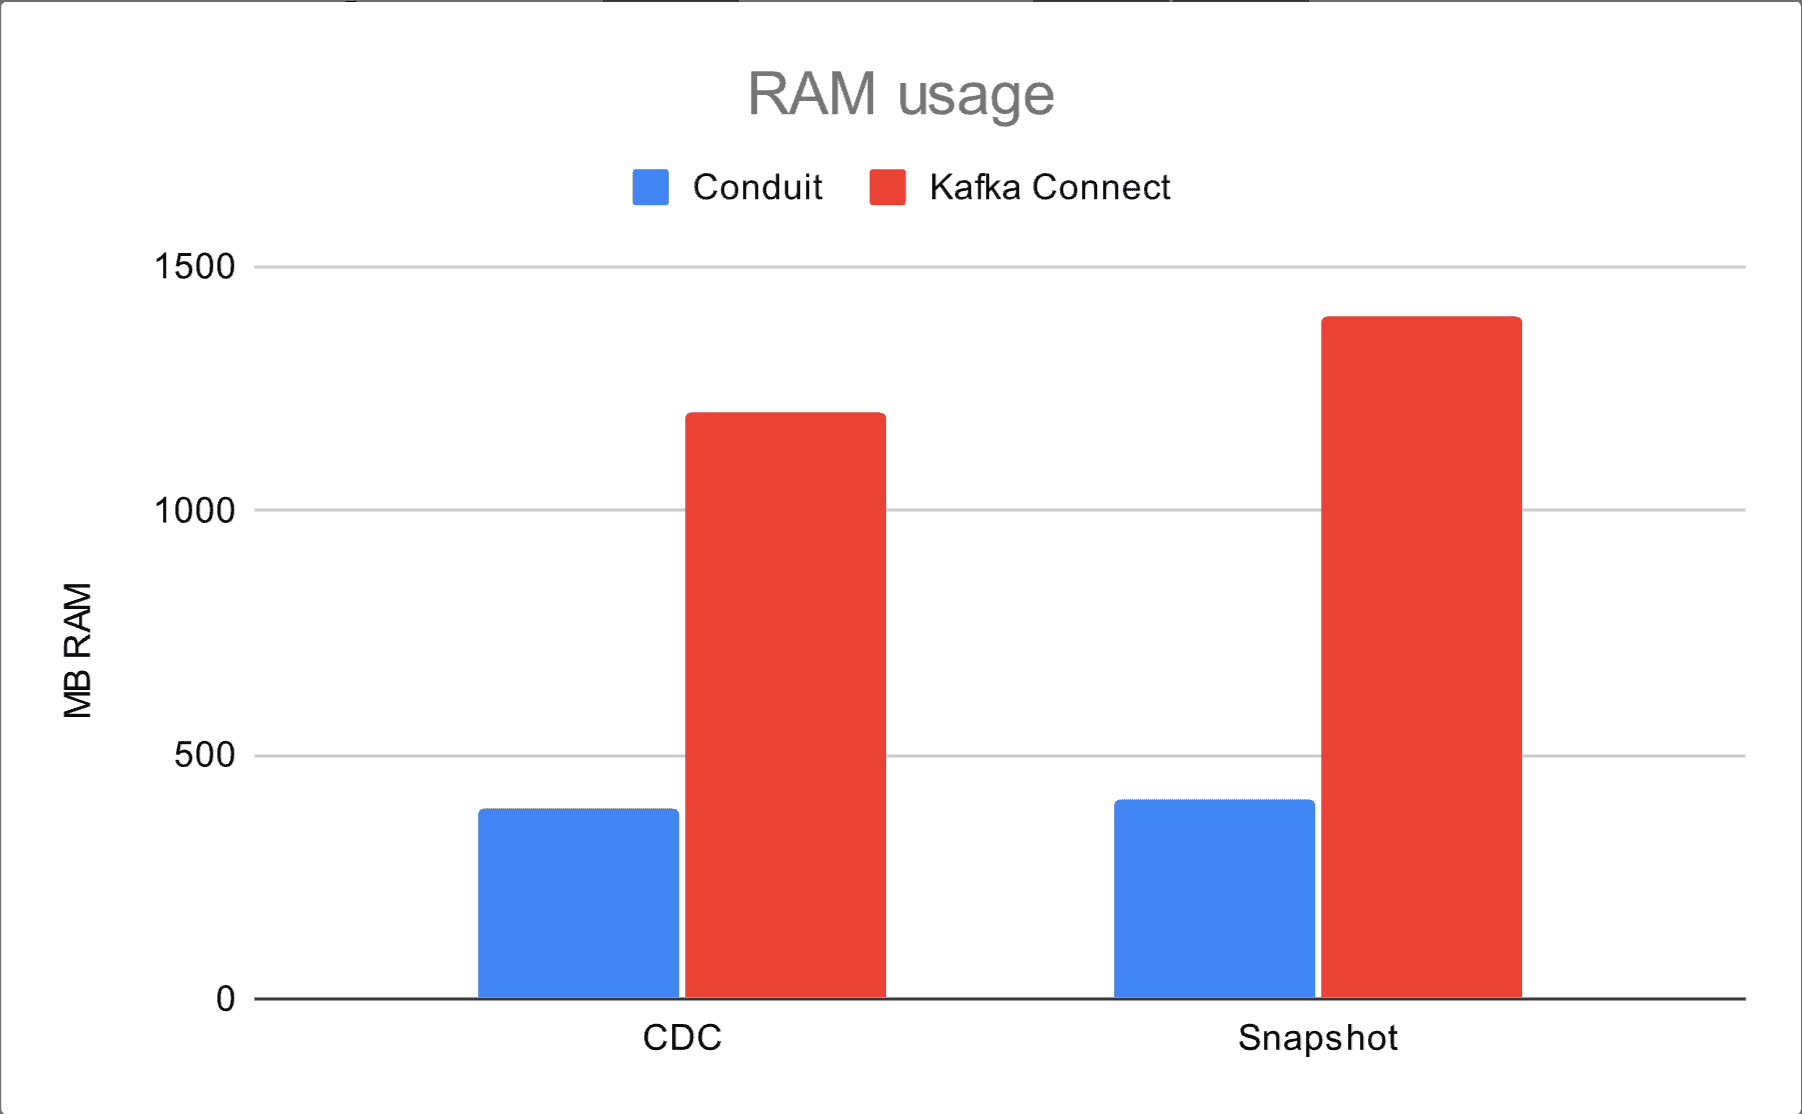
Conduit’s CPU usage is higher by around 13% in snapshots and 28% in CDC. When it comes to memory usage, we see a bigger gap, this time with Conduit using less resources (390 MB or 68%) than Kafka Connect (1200 MB).
While the snapshot message rates are pretty close (Conduit’s message rate is about 9% higher), we see a greater gap in CDC, where Conduit’s message rate is about 52% higher. We believe this is a significant result, given that pipelines will spend most of their time in CDC mode (a snapshot might take days, and the rest of a pipeline’s life, even after restarts, will be spent on capturing data changes).
Hello!
You might want to know more about these benchmarks, have ideas on how to tweak pipelines, or have found a mistake in how we ran the tests. If so, drop us a “hello!” on our Discord channel or open a GitHub discussion!