
Introduction
As we’re getting closer to the Conduit 1.0 release, we recently started conducting a series of benchmarks on our most popular connectors. We started with MongoDB and Kafka, and in this case, we were eager to run some tests using one of our built-in connectors.
More particularly, we wanted to put Conduit to the test, head-to-head against Kafka Connect, moving data from Postgres to Kafka. Our goal was to see just how much performance we could squeeze out of Conduit while still maintaining a reasonable usage of resources.
The results were very promising. Conduit moved data faster than Kafka Connect in both CDC and snapshot operations, and did it while using dramatically less memory in some cases, over 98% less. In this post, we’ll break down how we ran the tests, share the numbers, and show where Conduit really shines.
Methodology
Performance Measurement
To ensure consistency and accuracy, we used our own recently launched benchmarking tool, Benchi. Benchi collects throughput data using Conduit’s built-in metrics and Kafka’s JMX metrics, while CPU and memory usage is monitored through Docker runtime stats. This setup lets us compare both tools under identical, automated conditions using the following metrics:
- Message Throughput (messages per second)
- CPU Utilization
- Memory Usage
Snapshots vs CDC
Snapshot and CDC workloads have different performance profiles, so we made sure to configure them accordingly. Thankfully, Benchi allows us to do that very easily. The main differences in the setup were:
- Snapshot: All test data is loaded, and only once that is done, the pipeline starts running.
- CDC: Streaming is started and paused, data is inserted, then streaming resumes, forcing the pipeline into CDC mode.
The following setup ensured both tools processed the same data under the same conditions, depending on the mode (CDC or Snapshot).
Setup
All benchmarks ran on a t2.xlarge AWS EC2 instance (4 vCPUs, 16 GB RAM, 120 GB gp3 EBS volume). Kafka and Postgres ran in Docker containers, with a single Kafka broker and Postgres instance. While we did try different EC2 instances, we decided to go with a t2.xlarge considering it had reasonable capacity to give Kafka Connect a fair chance. For Conduit, you can certainly run your pipelines in a much more constrained environment, massively reducing your cost.
The amount of data we inserted into the Postgres instance for each test was 20 million records with the following schema:
CREATE TABLE employees (
    id INT NOT NULL,
    name VARCHAR(255),
    email VARCHAR(255),
    full_time BOOLEAN NOT NULL DEFAULT TRUE,
    position VARCHAR(100),
    hire_date DATE NOT NULL,
    salary REAL CHECK (salary >= 0),
    updated_at TIMESTAMPTZ DEFAULT NOW(),
    created_at TIMESTAMPTZ DEFAULT NOW(),
    PRIMARY KEY (id)
);
Conduit
We chose the latest Conduit released version v0.13.4 with the Postgres connector, using the new pipeline engine. Pipelines used initial_only for snapshots and logrepl with logical replication slots for CDC.
Kafka Connect
We ran Kafka Connect v7.8.1 with Debezium Postgres connector. Default worker settings, 10 GB heap (KAFKA_HEAP_OPTS: "-Xms10G -Xmx10G"), and tuned batch/queue sizes.
Full configurations are here and here.
Running the Benchmarks
To reproduce these results, you can simply run your own EC2 instance and follow these steps:
curl -L https://github.com/ConduitIO/streaming-benchmarks/archive/refs/heads/main.zip -o streaming-benchmarks.zip
unzip streaming-benchmarks.zip
cd streaming-benchmarks-main && make install-tools
make run-postgres-kafka-cdc
make run-postgres-kafka-snapshot
Results
Here’s how Conduit and Kafka Connect compare in both modes:
| Mode | Tool | Message Rate (msg/s) | CPU (%) | Memory (MB) |
|---|---|---|---|---|
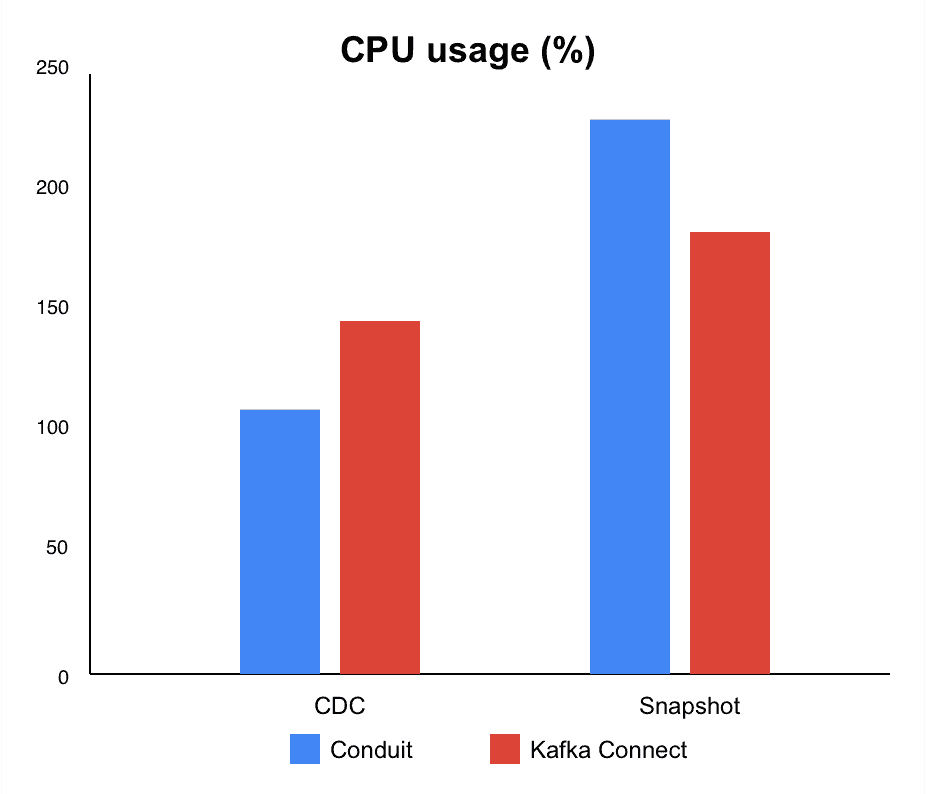
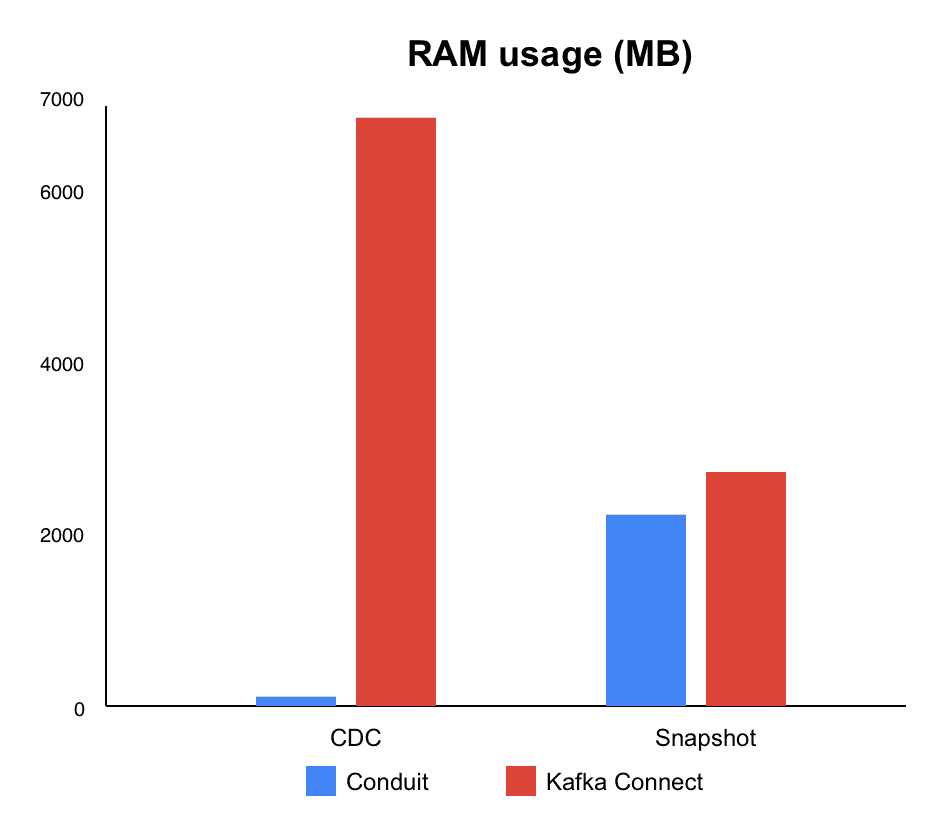
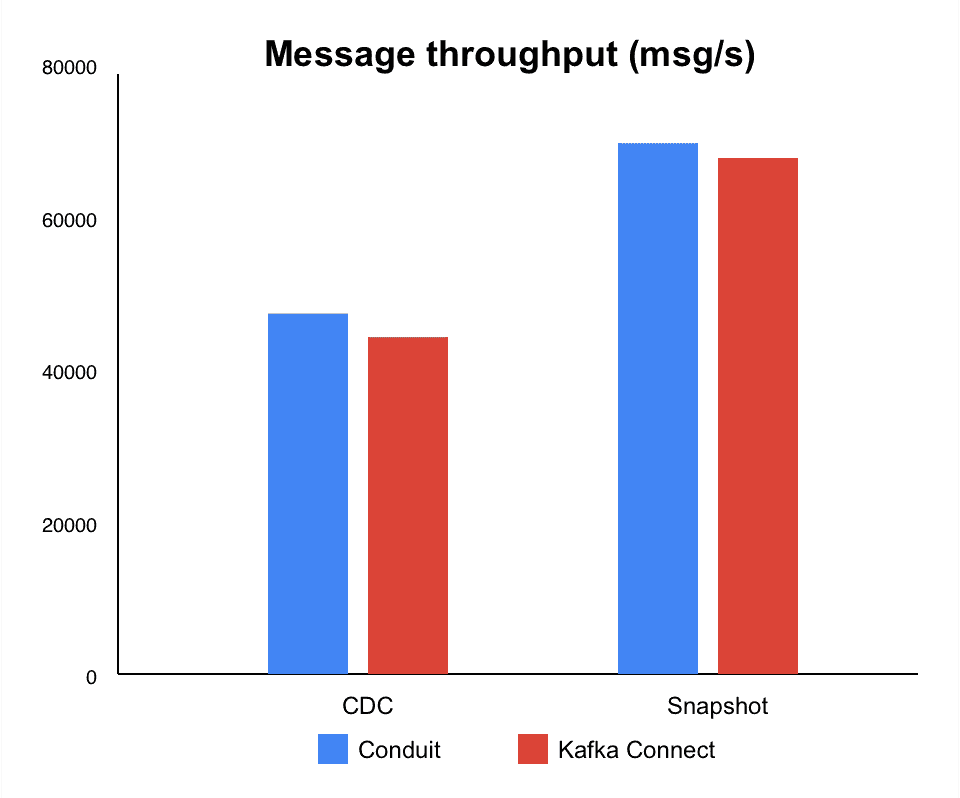
| CDC | Conduit | 48.060 | 110,2 | 110,2 |
| Kafka Connect | 44.889 | 147,1 | 6.863 | |
| Snapshot | Conduit | 70.753 | 231,0 | 2.234 |
| Kafka Connect | 68.783 | 184,2 | 2.729 |
In CDC mode, Conduit's combination of higher throughput and significantly lower memory usage makes the biggest difference. We called this a huge win since we consider that pipelines typically spend most of their time in CDC. Having this efficiency directly impacts day-to-day operations and can immensely reduce the cost of your infrastructure or simply expand the options for where you can run your pipelines.
For snapshots, the throughput gap ended up being smaller, though Conduit was still leading. In this case, memory consumption was still lower than Kafka Connect, but with higher CPU usage.
Charts
Key Findings
For Schema support, even though Conduit has the ability to maintain the schema on structured data through the pipeline, we decided to disable the schema extraction on the source as this was not necessarily needed, and we wanted to reduce the overhead. This can be accomplished by setting both sdk.schema.extract.key.enabled and sdk.schema.extract.payload.enabled to false in the source Postgres connector, and it had a direct impact on performance.
Implementing a ReadN method (supported thanks to our Connector SDK), we were able to start reading multiple records at the same time, pulling batches of changes in a single operation. The implementation of this method in the source Postgres connector resulted in a 7,2% improvement on CDC and a 2,4% boost on Snapshot.
CDC Mode
Conduit delivered 7% higher throughput (48.060 msg/s vs. 44.889 msg/s) and used 98% less memory (110 MB vs. 6.863 MB). CPU usage was also 25% lower (110% vs. 147%).
Snapshot Mode
When configuring the Postgres source, specifying your desired batch size via the connector configuration parameters snapshot.fetchSize and sdk.batch.size is relevant. The optimal value we came up with was 75000, though this number was purely experimental. For Conduit, we felt comfortable bumping up this number as memory consumption is clearly not an issue for it.
In the end, throughput was 3% higher for Conduit (70.753 msg/s vs. 68.783 msg/s), with 18% less memory used (2.234 MB vs. 2.729 MB). However, CPU usage was 25% higher (231% vs. 184%).
Future improvements
We believe there is still potential to continue increasing speed by experimenting with different methods for moving data between goroutines. When we conducted tests using channels with various batch sizes and buffering strategies, we saw dramatic differences in performance depending on how data was grouped and transferred.
For instance, sending 20 million objects one at a time over an unbuffered channel took around 5.5 seconds, while simply adding a buffer of size 50 brought that down to 1.8 seconds. The real breakthrough came when we increased the batch size to 1,000 or even 10,000—at that point, the total time dropped to just 80 ms, regardless of channel buffering.
Based on these results, we definitely consider it worth exploring batch sending from the CDC and snapshot iterators. There is a good chance we can achieve even greater performance by sending records in groups rather than one at a time. Considering Conduit is JVM free, the only foreseeable future we anticipate for improvements is an even higher throughput without being concerned about our resource consumption. 🚀
Let’s Chat!
Curious about these benchmarks? Have ideas for new tests, or want to share your own results? Join us on Discord or start a GitHub discussion.

Raúl Barroso
Raúl Barroso is a coffee nerd who joined Meroxa in 2021 as a Principal Software Engineer. He was born in Tenerife and lived in San Francisco, but you can find him in Madrid these days.


